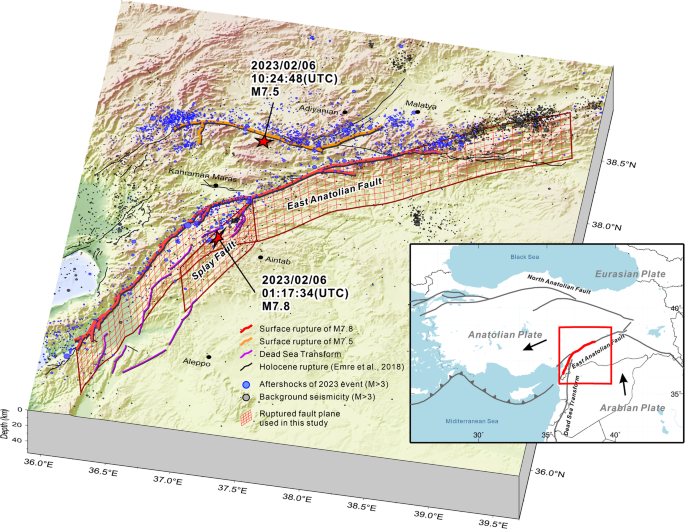
Abnormal apparent supershear rupture with discontinuous jumping propagation during the 2023 Türkiye M7.8 earthquake – Communications Earth & Environment
Spatial and temporal slip distribution
The joint source inversion results indicate that the spatial slip distribution of the Türkiye earthquake was complex, spanning a long 350 km ruptured zone (Fig. 2). To provide further insight, fits between observed data and synthetic data of the teleseismic waveform, local ground motion, and coseismic displacement are shown in Supplementary Fig. S1 to Fig. S3. The slip mainly occurred on the EAF fault plane, and four asperities were identified. The slip originated on the splay fault with a small movement of about 0.6 m near the hypocenter. A large amount of slip occurred at the eastern boundary of the splay fault, forming a connection with the main fault to form Asperity I.
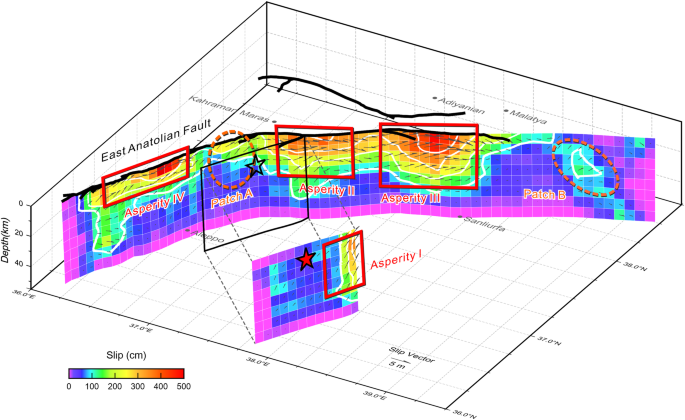
Open and red solid stars are the hypocenters on the splay fault. Red rectangular indicates the four asperities on the fault plane. The dotted circles are the two slip patches.
Asperity II was located close to the epicenter on the EAF fault plane, and part of its slip area was connected with Asperity I on the splay fault. This slip area has been found in other studies on the finite-fault source model10,11,12,14,16,17,18,19,20. The maximum slip exceeded 3.5 m, mainly strike-slip with rake approximately ± 10°. The deepest part of this asperity is about 30 km deep, and its shallowest part extends to the ground surface. Asperity III was located on the EAF fault plane northeast of Asperity II. This asperity was the largest in the Türkiye earthquake, extending from 37.6°E to 38.3°E and reaching a depth of approximately 40 km. Its dimensions spanned about 80 × 40 km2. The slip area extended to the shallow fault with an extremely large surface rupture of about 5.0 m. The slip was mainly strike-slip with some upward movement (rake approximately 5°) near the surface. This large slip zone has been discussed in most of the source studies10,11,12,14,16,18,19,20. Asperity IV was located in the southwestern part of the EAF fault plane. The size of this asperity was compact, about 70 × 15 km2, which concentrated between 0 km and 15 km depths with a maximum slip up to 5.0 m. The movement on this asperity was mainly strike-slip with some upward moment (rake > 10°). Several studies8,9,11,13,15,17 have also proposed similar slip patterns in this area.
In addition to the above four asperities, two smaller slip patches were observed. A slip patch (Patch A) was found between Asperity II and Asperity IV on the EAF near the hypocenter. This patch’s slip is insignificant, measuring less than approximately 2.0 m compared with other asperities. Furthermore, some small slips (Patch B) were found at the northeastern end of the EAF ruptured plane. The slip in this area was also small, less than 2.0 m. These minor slips are confined to the middle to deep crust (depths ranging from 15 km to 40 km) without extending to the ground surface.
With all these four asperities and two slip patches, the entire slip zone demonstrated a long rectangular shape that extended from southwest to northeast and exceeded 350 km. Considering a strike-slip rectangular fault with a width (\({{{{{\rm{\omega }}}}}}\)) of 30 km in a homogeneous half-space, the stress drop (\(\triangle \sigma\)) can be determined using the formula21 \(\tfrac{2}{\pi }\mu \left(\tfrac{\bar{D}}{\omega }\right)\), where \(\mu\) represents the shear modulus (3.0E + 10 N m-2), and \(\bar{D}\) is the average slip. Given that the slip area was confined to values greater than 0.1 m, the average slip (\(\bar{D}\)) measured approximately 1.2 m. Consequently, the mean stress drop observed over this extensive fault area was estimated to be 0.77 MPa.
Similar to its complex spatial slip distribution, the temporal rupture time history of the 2023 M7.8 Türkiye earthquake is also complicated (Fig. 3 and Supplementary Video S1) and can be divided into four stages. In the first stage, a small slip originated on the splay fault at 0–8 s with a relatively small slip of less than 50 cm near the hypocenter. Subsequently, at approximately 10 s, slip activity started on the southwest segment of the EAF (the area marked “a” in Fig. 3). This abnormally early slip area is disconnected from the initial rupture on the splay fault. Thus, this rupture was not propagated along the splay fault, and its behavior is similar to a jumping rupture that was dynamically triggered by body waves (P or S waves). Between 14 s and 20 s, the eastern side of the splay fault kept slipping to form Asperity I.
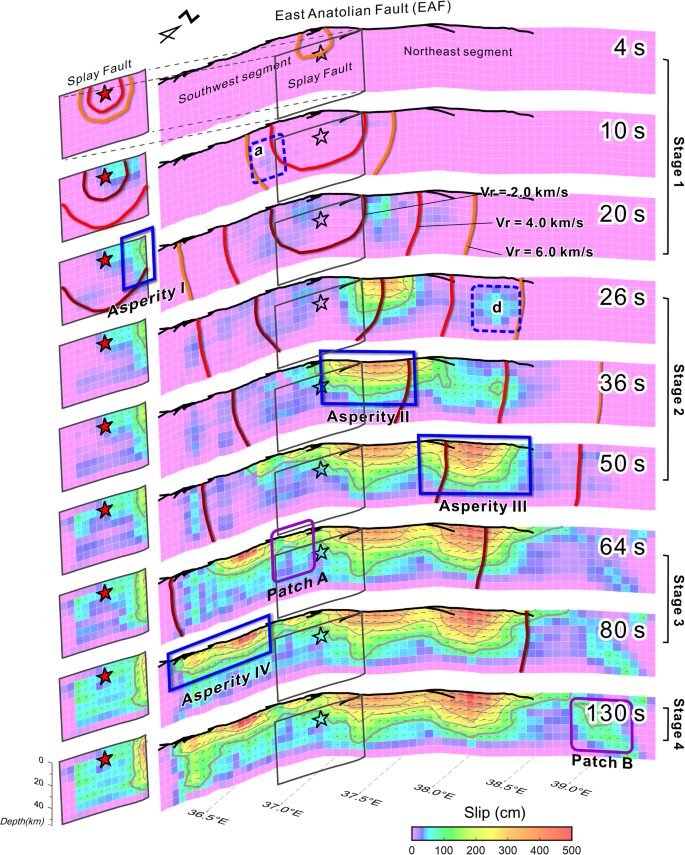
Three reference rupture fronts with constant rupture speed Vr = 6.0, 4.0, and 2.0 km s-1 are shown with orange, red, and deep-red contours, respectively. Blue rectangular indicates the four asperities.
In the second stage, the rupture started to propagate onto the junction area of the EAF and splay fault planes. After 20 s, the rupture mainly occurred on the EAF fault plane and propagated bilaterally from the junction area. It propagated near the junction in the northeastern direction between 36.9°E and 37.5°E. This area ruptured for a long period, spanning 20 s to 32 s, gradually forming Asperity II on the EAF. It is noted that, during the development of Asperity II at approximately 26 s, the deeper part (20–30 km depth) of the northeastern EAF (the area marked “d” near 38.2° E in Fig. 3) started to slip far ahead of the main rupture front. The slip in this area also behaved as a jumping rupture since it occurred before the main propagating front arrived. The slip behavior in this area continued for an extended period, from 26 s to 50 s, and eventually combined with the main subshear rupture. This merging gave rise to the largest asperity (Asperity III) observed on the EAF.
Between 50 s and 100 s, the third rupture stage mainly developed in the southwestern section of the EAF. It propagated southward and slipped for nearly 50 s between 35.7°E and 36.7°E. The rupture gradually formed slip Patch A, whose location almost overlapped the area where the earliest slip occurred (marked “a” in Fig. 3). Asperity IV was formed subsequently near the southern end of the EAF. The fourth stage developed before the rupture termination. Some slip occurred in the deep crust (between depths of 20 km and 40 km) of the easternmost part of the EAF fault plane. Over time, these small slips gradually interconnected between 100 s and 120 s, forming slip Patch B.
This complex rupture process is also presented in the moment rate function (Fig. 4), where several energy bursts can be identified. The first peak of moment release occurred between 0 s and 18 s. This is the seismic moment released from the splay fault (Asperity I) and the early triggered slip at the southwestern segment of the EAF. Asperity II and Asperity III on the EAF contributed to the second and third peaks of seismic moment between 18 s and 50 s, with some parts of the moment release overlapping. They collectively contributed a seismic moment of 4.81 × 10²⁰ Nm, which accounts for approximately 53% of the total moment, corresponding to an Mw 7.72 earthquake. The westernmost asperity (Asperity IV) contributed to the seismic moment release at 50 s to 100 s, with several energy bursts. The seismic moment release in this period was nearly 3.60 × 10²⁰ Nm, equivalent to magnitude Mw 7.64. Additionally, some minor moment releases were observed after 100 s, with a peak at approximately 115 s before the end of the rupture. These were caused by the easternmost rupture (slip Patch B), contributing to the seismic moment of nearly 0.33 × 10²⁰ Nm. The overall duration of the rupture lasted approximately 120 s and resulted in a seismic moment release of 9.12 × 10²⁰ Nm, which is equivalent to a moment magnitude of Mw 7.91.
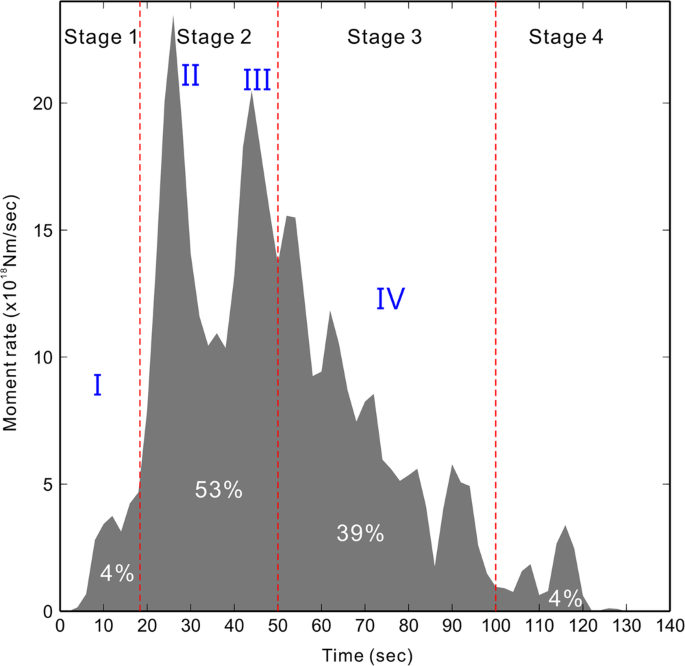
The dark gray area shows the moment release time history. Four time periods of the seismic moment releases are marked with Stage 1 to Stage 4. The blue numbers indicate the moment releases of the four asperities. White numbers show the percentage of moment release from the total moment in each stage.
Rupture velocity on the fault plane
To evaluate the rupture speed on the fault plane, three reference rupture fronts with constant rupture velocities (Vr) of 6.0, 4.0, and 2.0 km s-1 were marked in Fig. 3 and Supplementary Video S1. These reference rupture fronts propagated in the three-dimensional half-space rather than along the fault plane, which is similar to the 3D wave propagation fronts. In this case, the dynamic triggering of slip induced by the strong seismic waves can be considered and identified. As discussed in the temporal rupture process section, an abnormally early rupture was found on the southwest segment of the EAF (marked “a” in Fig. 3) at approximately 10–12 s, in which the slip occurred just after the 6.0 km s-1 reference rupture front. This implies that the rupture at this moment was faster than the local shear wave velocity (approximately 3.5–4.0 km s-122,23,24,25). The development of Asperity II had a slower rupture speed because most of the slip gradually occurred with the reference rupture front of 2.0 km s-1. Relatively, the east part of Asperity III started to slip at approximately 26 s in the deep crust just after the 6.0 km s-1 rupture front (the area marked “d” in Fig. 3). Once again, this slip exhibited characteristics of an abnormal apparent rupture speed. It is worth noting that Asperity II was still under development at this time (nearly 26 s), and its continuous subshear rupture front was slowly expanding eastward toward Asperity III. The rupture speed of Asperity IV at the westernmost side of the EAF was slow, and that rupture was between 50 s and 100 s, with a rupture speed lower than 2.0 km s-1. It is worth noting that the southwestern segment of the fault underwent repeating slips with extreme changes in rupture velocity, with apparent rupture speed close to 6.0 km s-1 at approximately 10–12 s (marked by “a” in Fig. 3) and subshear rupture between 50 s and 100 s (Patch A and Asperity IV in Fig. 3). Finally, slip Patch B in the deep part of the easternmost fault plane developed slowly with a rupture speed of approximately 2.0–3.0 km s-1 after 100 s.
We further analyzed the spatiotemporal distribution of the maximum slip rate along the fault strike to extract more rupture information (Fig. 5). Results show that the main rupture fronts on the EAF generally propagated at subshear speeds, which varied around 3.0 km s-1. Meanwhile, the occurrence times of triggered slips at areas “a” and “d” are far ahead of the main rupture front along the EAF. This implies that the triggered slips in these areas can have an abnormal apparent rupture speed caused by jumping ruptures, resulting in their apparent rupture velocity almost close to the P wave speed. Some other orange spots can be found earlier than the main rupture front (Fig. 5a). However, these spots occurred after “a” and “d”, indicating that they were subsequent ruptures following the new rupture fronts produced by triggered slips “a” and “d”. That is, triggered slips resulted in apparent supershear phenomena and produced new rupture fronts that can cause other slips to occur ahead of the main rupture front.
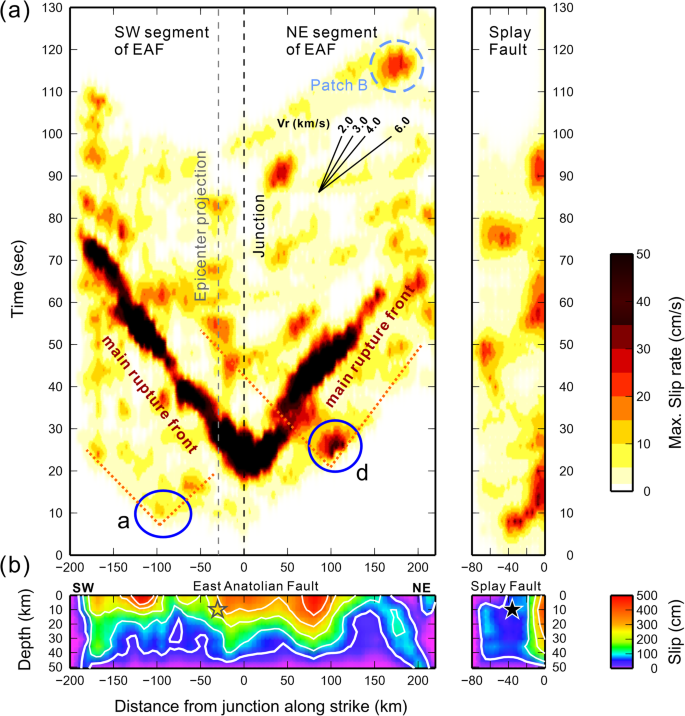
a Spatiotemporal distribution of maximum slip rate along strike of the fault. b The slip distribution. The maximum slip rate is derived from the maximum value of the slip rate in all depths and then projected to the strike along the fault. Black solid and open stars show the hypocenter on the splay fault and the location projected on the EAF. Blue circles indicate the areas “a” and “d” where the abnormal apparent supershear rupture occurred. Orange dotted lines show the new rupture front originating from triggered slips at “a” and “d”.
Slip Patch B occurred near the end of the rupture and was also presented as an isolated spot apart from the main rupture front. Furthermore, the southwestern segment of the EAF experienced several times of rupture, which could be due to (1) early triggered slip, (2) followed by the main rupture propagation, and (3) later stress interactions. These phenomena could correspond to a combination of some dynamic rupture scenarios under specific assumptions26. A similar rupture behavior was also found on the splay fault, in which the whole fault plane repeated slip several times during the 100 s long rupture time history. This could be the reason why the strong ground motion waveform observed at vicinity stations (2703, 2711 in Fig. S3b) has several complex wiggles compared to other near-fault stations (2712, 3143 in Fig. S3b). The stress interactions between Asperity I, II and III could play a important role in the reaction of the slip on the splay fault plane.
We made additional tests to provide compelling evidence that the source features identified in this study are robust and not artifacts, especially the triggered slips. The tests include (A) inversion with various numbers of time windows, (B) inversion with different data sets, (C) comparing the synthetic seismograms of triggered slips to the observed waveforms, and (D) realistic resolution test. The details of these results are provided in the supplementary text. The outcomes of these tests underscore the efficacy of joint source inversion in resolving both spatial and temporal slip patterns, even accounting for complex triggered slips during the rupture process. It is worth noting that in test (C), the triggered slip at area “d” significantly contributes to the teleseismic waveforms. The contribution of weak triggered slip at area “a” can also be observed in most stations, but it is not that apparent. This could be due to the small seismic energy released from the area “a” (7.89 × 10¹⁸ Nm ~ Mw6.53), only about 0.86% of the total moment (9.12 × 10²⁰ Nm ~ Mw7.91). In other words, the large local strong ground motion dominates the main rupture characteristics on the fault plane and overshadows the contributions from relatively weak triggered slips in most of the local waveforms.
Our results are consistent with several recent investigations that have identified supershear propagation during the rupture of this event. Rosakis et al.27 provided evidence for an instantaneous supershear speed of nearly 1.55 times the Vs close to the epicenter. Delouis et al.14 identified several portions of the EAF where the rupture accelerated to supershear with a speed of approximately 4.0 km s-1. The first occurred in the southern section of EAF, about 80 km from the junction. This is like our apparent supershear founding in area “a”. The second one was located at the northern segment of EAF, about 100 km away from the junction, and this area is close to our result in area “d”.
However, our result had a different interpretation of the high rupture speed phenomenon. Delouis et al.14 indicated it as supershear, while we attribute it to apparent supershear caused by a jumping rupture. These differing explanations may arise from different foundational assumptions in the inversion. Delouis et al.14 constrained that the rupture propagated continuously, which needed to occur after it propagated to the EAF through the junction. Then, the rupture speed gradually transitions to supershear on the EAF. Our study used the Vrmax (6.0 km s-1) to estimate the earliest rupture front propagated in the three-dimensional half-space rather than along the fault plane. By doing so, the inversion can determine whether the rupture is subshear, supershear, or even a jumping rupture. According to our joint inversion result, we proposed that the high rupture speed found in areas “a” and “d” was an apparent supershear phenomenon caused by triggered slips ahead of the main rupture front. This resulted in the apparent rupture velocity being higher than the shear wave speed in the surrounding rock.
The high rupture speed phenomenon was also observed from a dynamic rupture model proposed by Wang et al.13. In their model, supershear rupture was observed in the northeastern region of the EAF, and the rupture speed along the southwestern segment of the EAF exhibited variations between supershear and subshear. It is noted that these models are based on the assumption of continuous rupture systems and may not account for discontinuous jumps, potentially leading to a misinterpretation of rupture jumps as continuous supershear ruptures.
The abnormally high apparent rupture speed of over 4.0 km s-1 occurred during the early development of slip Patch A, and the deep slip of Asperity III might be attributed to two potential factors. The first is that a new rupture (the initiation of slip Patch A, i.e. area “a” marked in Fig. 3) was dynamically triggered by a strong seismic wave propagating at P wave speed; this led to an increased apparent rupture velocity found at the initial stage (10 s) of the earthquake on the EAF. Secondly, the average Vs is approximately 4.0 km s-1 within the deeper crust (~ 30 km), which could further contribute to a heightened rupture velocity. However, when Asperity III initially formed at the deep crust (area “d” in Fig. 3), its apparent rupture velocity exceeded 4.0 km s-1, implying that dynamic triggering provides a more plausible explanation in this area. Dynamic stress triggering is a common phenomenon in which the propagating seismic waves caused by large earthquakes trigger other distant events28,29,30,31,32. However, the phenomenon of dynamic triggering, causing distant areas on the same fault system to slip before the main rupture front during the rupture process of a major earthquake, is rarely observed and challenging to identify33,34. The 2023 Türkiye earthquake may be one of those rare cases.
Centroid location versus maximum rupture speed
To verify the reliability of the abnormally high rupture speed discovered by finite-fault source inversion, a centroid moment tensor (CMT) analysis was performed through a comprehensive grid search to find the best-fit centroid position. A dense virtual point was set for the grid search of the CMT inversion (Supplementary Fig. S4). Here, the CMT analysis based on the observed teleseismic data was investigated first (Fig. S5). Then the result was compared with that of CMT inversion results derived from the synthetic waveforms according to finite-fault source inversion models with maximum rupture velocities (Vrmax) of 2.0, 3.0, 4.0, 5.0, 6.0, and 7.0 km s-1. Results show that the slip was closer to the hypocenter if the Vrmax was smaller. The larger Vrmax resulted in a wider spread of slip patterns. The slip distribution became stable when Vrmax is greater than or equal to 6.0 km s-1. Their related CMT analysis results are provided in Supplementary Figs. S6 to S11. The finite-fault inversion results with varied Vrmax are provided in Supplementary Fig. S12.
The CMT of the Türkiye earthquake shows that the focal mechanism is generally a strike-slip fault (Fig. 6), which is consistent with most of the CMT reports (Table 1). However, it contains a large part of the compensated linear vector dipole (CLVD) component, approximately 22% of the total moment. This result may be attributed to the intricate slip distribution, the curved fault geometry, and the unusually extended rupture length, all of which deviate from the assumption of a point source. The centroid is located approximately 72 km east of the epicenter and is somewhat offset from the EAF, which is approximately 20 km to the south. The moment tensor solutions determined from the finite-fault synthetic waveforms presented a similar strike-slip focal mechanism with part of CLVD component (Table 1). These CMT centroid locations show a remarkable linear trend, i.e., the larger the maximum rupture velocity set in the finite-fault inversion, the more the centroid locations were moved to the northeast (Fig. 6 and Table 1). The centroid positions determined using Vrmax values of 6.0 km s-1 and 7.0 km s-1 closely align with the position determined from the observed data. This result implies that the maximum rupture speed in the Türkiye earthquake could reach up to 6.0 km s-1, which further validates our finding of abnormally high-speed apparent supershear rupture in the finite-fault source inversion.
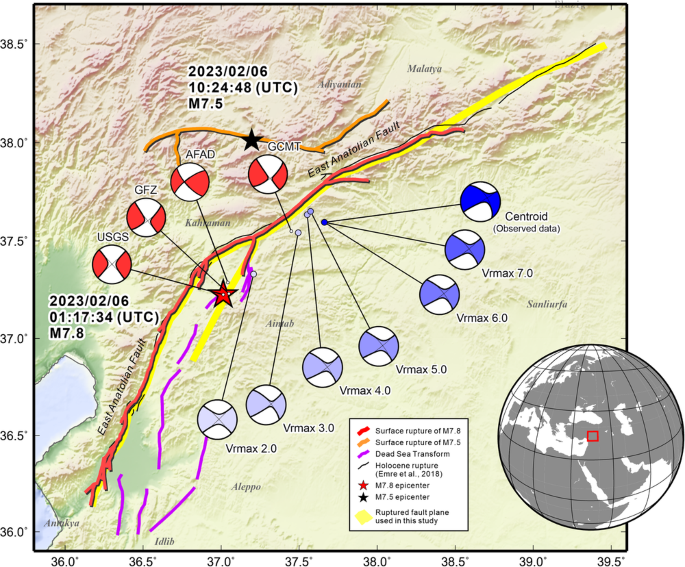
The red star is the M7.8 event epicenter, and the black star shows the M7.5 event epicenter. The red focal mechanisms are CMT reports by the USGS, GCMT, GFZ, and AFAD. The focal mechanisms colored by light to deep blue are the CMT inversion results based on the finite-fault source models with maximum rupture velocities of 2.0, 3.0, 4.0, 5.0, 6.0, and 7.0 km s-1, respectively. The blue focal mechanism is the CMT determined by the teleseismic observed waveforms. Circles indicate their related centroid locations. All of these centroid parameters are provided in Table 1. The map was generated by the GMT v.4.3.1 (https://www.generic-mapping-tools.org/).
The finite-fault inversion result shows a moment magnitude of Mw 7.91, this is more than Mw 7.8, as the USGS and IRIS reported. It is crucial to note that the moment magnitude taken from the general earthquake report is usually derived from the CMT analysis, which considers the earthquake as a point source. However, if the rupture length of an earthquake is long, the point source assumption may not be appropriate, thus causing a bias in the seismic magnitude. This is also consistent with the previous centroid location analysis. The moment magnitude determined from the CMT inversions based on synthetic or observed data is approximately Mw7.73 to Mw7.82 (Table 1). The other potential cause of the difference in magnitude is the used frequency band. For the finite-fault source inversion, the teleseismic waveforms are bandpassed between 2 s and 100 s. The CMT inversion usually uses a lower frequency band; in our case, the waveforms are bandpassed between 100 s and 200 s. This implies that the CMT inversion might lose the high-frequency seismic energy released from small slip patches, thus underestimating the earthquake magnitude and the total seismic moment.

